The Rs 3.22 Lakh Crore Green Transition
From Compliance to Competitive Advantage — ESG is Driving the Next Phase of India’s Building Materials Growth
As sustainability regulations tighten and infrastructure investments accelerate across highways, metros, urban infrastructure, and energy projects, India’s building materials sector is entering a decisive phase. ESG is no longer confined to reporting frameworks; it is increasingly influencing project specifications, procurement decisions, and long-term competitiveness. The industry is undergoing a structural shift towards lifecycle performance, carbon efficiency, and sustainable material adoption — transforming what was once viewed as compliance into a significant business opportunity for material producers, as regulatory shifts and evolving market demand redefine business strategies across the industry.Abinash Mishra shares his observations on how India’s April 2026 EPR deadline is separating market leaders from Market Exits (late adopters) and the compliance-to-advantage playbook is delivering up to 34% carbon reduction and 15% premium pricing.

April 2026 isn’t just another regulatory deadline. It’s the inflection point where India’s Rs 6.4 lakh crore building materials industry splits into two categories: companies that saw ESG as compliance burden, and companies that weaponized it into competitive moats.
The Extended Producer Responsibility (EPR) regulations mandating 5-25% recycled content in construction materials by 2031 aren’t bureaucratic paperwork. They’re market restructuring events disguised as environmental policy.
Here’s what the compliance-focused companies miss: The Rs 3.22 lakh crore green building materials market by 2032 isn’t growing because of regulations. Regulations are accelerating adoption of what commercial real estate, infrastructure agencies, and premium residential developers already demand.
After 28 years across cement, steel, paints, and allied building materials—from manufacturing turnarounds to advising NCRTC and national infrastructure agencies on material specifications—one pattern has become undeniable: companies that treat ESG purely as a compliance cost risk falling behind competitors that use it as a driver for margin expansion and long-term competitiveness.
The question isn’t whether to pursue green transition. The question is whether you’ll lead it profitably or follow it expensively.
The Rs 3.22 lakh crore Market Reality Behind Regulatory Theater
The numbers tell a story often overlooked in regulatory discussions: India’s green building materials market is projected to grow from Rs 1.55 lakh crore in 2025 to Rs 3.22 lakh crore by 2032. This represents an 11.3% CAGR — nearly three times faster than the growth of conventional materials.But here’s the disconnect: Most CEOs see April 2026 EPR deadline and calculate compliance costs. Elite operators see the same deadline and calculate competitive advantage windows.
The regulatory landscape driving this includes:
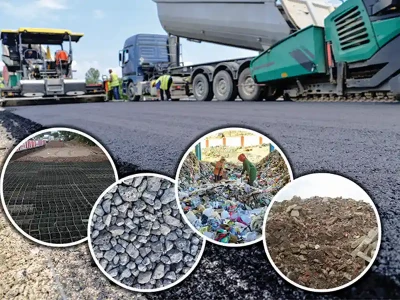
Extended Producer Responsibility (EPR) - April 2026 Implementation: Construction & Demolition (C&D) waste: 5% recycled content by 2026, scaling up to 15% by 2028 and 25% by 2031. The regulation covers cement, concrete, aggregates, bricks, tiles, and steel. Non-compliance may lead to production restrictions and limitations on market access.
Energy Conservation Building Code (ECBC) – Mandatory 50% Energy Savings: Applicable to commercial buildings larger than 100 sq meters, the code mandates insulation materials, energy-efficient facades, and reflective surfaces, creating structural demand for green building materials. Non-compliance can block occupancy certificates in major cities.
Green Building Certifications – Market Access Requirements: LEED certification is increasingly mandatory for Grade A commercial real estate. IGBC ratings are often required for government infrastructure projects, while GRIHA standards are becoming the default for affordable housing schemes. These certifications require specified percentages of sustainable materials.
Carbon Border Adjustment Mechanism (CBAM) – Export Implications: The EU’s CBAM is affecting Indian steel, aluminium, and cement exports from 2026 onward. Carbon intensity documentation is becoming an export prerequisite. Companies without carbon tracking risk losing international market access, while strong domestic green credentials can enable exports.
The pattern: Regulations are not creating green demand; they are formalizing what premium segments already require and preventing laggards from participating.
Why Traditional ESG Programs Destroy Value

Visit any cement or steel plant that launched “sustainability initiatives” in the last three years and you will find identical symptoms:
The Compliance Silo: The CSR team owns sustainability but remains isolated from operations. Reports are created for annual disclosures and remain disconnected from the P&L. Metrics are tracked because regulations require them, not because they drive business decisions. The CEO mentions ESG in investor calls but cannot explain its operational integration.
Reality: Siloed ESG programs cost money, generate reports, and change nothing material about a company’s competitive position or margins.
The Green Premium Trap: Product teams develop “eco-friendly” SKUs at 20–30% price premiums, and marketing positions them as “sustainable alternatives. Customers nod approvingly but continue to buy conventional products. Green SKUs account for only 2–3% of the portfolio, serving mainly to justify ESG claims while generating minimal revenue.
Reality: Premium pricing without a differentiated value proposition does not create markets; it creates virtue-signaling products that nobody buys at scale.
The Technology Pilot Paralysis: Innovation teams pilot solar installations, waste heat recovery, and alternative fuels. The pilots show positive ROI in controlled environments, but scaling discussions remain trapped in “more analysis needed” for 18–24 months. Meanwhile, operational teams continue with business as usual.
Reality: Perpetual pilots signal indecision, not innovation. Markets reward scaled execution, not R&D theater.
The Reporting Over Reduction Delusion: Companies make significant investments in carbon accounting, ESG reporting platforms, and third-party audits. Current emissions are beautifully documented and extensively analyzed, yet there is minimal investment in actual reduction initiatives. As a result, annual reports highlight “improved transparency” while emissions remain flat.
Reality: Measuring problems doesn’t solve them. Carbon accounting is prerequisite, not achievement.
These patterns share common DNA: Treating ESG as reputation management rather than operations transformation.
The financial consequences are predictable:
Rs 10–50 lakh in annual ESG program costs (consultants, reporting, audits), plus Rs 20–40 lakh in opportunity costs (management time spent on reporting instead of execution), result in zero margin improvement, zero competitive differentiation, and leave companies vulnerable to competitors who operationalize sustainability. The outcome is an expensive compliance-driven approach that weakens market position.
The Companies at Risk of Market Exit (And the Ones That Will Dominate)
April 2026 EPR implementation creates three distinct company trajectories:Category 1: The Compliance Minimalists (Market Exit by 2028)
Profile:- Wait until April 2026, scramble for 5% recycled content requirement - Source cheapest available recycled aggregates, blend minimally - Continue conventional production processes otherwise - Calculate compliance as pure cost center - Hope requirements don’t escalate (they will - 15% by 2028, 25% by 2031)
Why They Fail:- Premium developers and infrastructure agencies demand 15-20% recycled content NOW (ahead of mandates) - Minimal compliance products don’t qualify for LEED/IGBC certifications - Unable to bid on green-certified projects (fastest growing segment) - Competitors offering genuine green products capture quality-conscious segments - Each regulation escalation (2028, 2031) becomes crisis, not progression
Timeline to Market Exit: 18-36 months as green-certified projects become majority
Example Warning Signs: - “We’ll deal with EPR when it’s mandatory” - “Our customers don’t really care about sustainability” - “Green products are niche markets” - CFO calculating compliance as minimum cost to avoid penalties.
Category 2: The Fragmented Adopters (Surviving, Not Thriving)
Profile:- Launch green product lines alongside conventional products - Invest in some waste reduction, partial renewable energy - Achieve certifications for select facilities - Market green credentials, maintain conventional operations as core - Gradual transition approach, hedging both sidesWhy They Underperform:- Split operations create complexity without scale advantages - Green products carry cost penalties from sub-scale production - Unable to price premium (not differentiated enough) or cost-competitive (not scaled enough) - Organizational confusion between two product philosophies - Competitors with unified green strategy achieve better economics
Outcome: Stable market share, declining margins, vulnerable to disruption
Financial Reality:- Green products: 15-20% of revenue, 8-12% margins - Conventional products: 80-85% of revenue, 18-22% margins - Blended margins declining as market shifts green - Investment split between two strategies, neither optimized
Category 3: The Systematic Transformers (Market Leadership by 2028)
Profile:- Comprehensive green transition across entire portfolio - Operations redesigned around sustainability as efficiency driver - Product strategy centered on green differentiation - Supply chain rebuilt for circular material flows - Pricing power from genuine differentiation + scale economics
Why They Dominate:- Unified strategy creates operational scale advantages - Green processes often more efficient than conventional (lower energy, waste recovery value, optimized material use) - Premium pricing justified by certifications, specifications compliance, verified performance - First-mover advantages in supplier relationships, customer partnerships, talent acquisition - Each regulation escalation strengthens position vs. lagging competitors
Financial Outcomes:- 12-18% premium pricing on certified green products - 15-20% lower energy costs from process optimization - 8-12% material cost reduction from waste recovery - Qualification for 100% of green-certified projects - Net result: 340-400 basis points EBITDA improvement
Strategic Moats Created:- Technical expertise (green formulations, recycled content integration) - Certification advantages (LEED, IGBC, GRIHA pre-qualified) - Supply chain lock-in (long-term recycled material sourcing agreements) - Brand positioning (sustainable = premium in customer perception) - Talent attraction (engineers want to work on green innovation)
The Compliance-to-Advantage Framework That Actually Works
Systematic transformation isn’t aspirational. It’s engineered.The companies achieving 34% carbon reduction while expanding margins follow identical playbooks. Not because they copied each other. Because the physics and economics dictate specific sequences.
Phase 1: Regulatory Compliance as Foundation (Months 0-6)
The Starting Point Isn’t Vision. It’s Mapping Current Reality.
Most companies don’t know their actual environmental footprint with precision sufficient for optimization. Carbon accounting, waste stream analysis, and energy audits aren’t bureaucratic requirements. They’re operational intelligence.
Critical Actions:- Comprehensive carbon footprint mapping across Scope 1, 2, 3 emissions - Waste stream characterization (types, volumes, disposal costs, recovery potential) - Energy consumption patterns by process, facility, time-of-use - Water usage and discharge analysis - Material flow mapping (virgin vs. recycled content current state)
Technology Deployment:- IoT sensors for real-time energy, water, waste monitoring - Carbon accounting platforms (not spreadsheets) - Supply chain transparency tools tracking material origins - Automated ESG reporting infrastructure
EPR Compliance Baseline:- Identify 5% recycled content pathway for April 2026 - Secure recycled material suppliers (C&D waste processors, industrial waste sources) - Validate recycled content integration without performance degradation - Establish testing protocols for recycled material quality assurance
Investment Required: Rs 25-60 lakhs (varies by facility size, existing infrastructure)
Why This Matters: Can’t optimize what you don’t measure. Compliance mapping reveals efficiency opportunities disguised as environmental requirements.
Real Example: Major cement manufacturer’s carbon accounting revealed Scope 3 emissions (supply chain) represented 60% of total footprint. Shifted optimization focus from owned operations to supplier engagement. Result: 22% emissions reduction at negative cost (supplier efficiency sharing model).
Phase 2: Operational Efficiency as ESG Multiplier (Months 6-18)
The Insight Regulators Miss: Green Operations Are Usually More Efficient Operations.
Energy efficiency, waste reduction, and water optimization don’t just reduce environmental impact. They eliminate operational costs.
Energy Optimization:- Waste heat recovery systems (cement kilns, steel furnaces generate massive recoverable heat) - Variable frequency drives on motors (15-25% energy reduction) - LED lighting + smart controls (40-50% lighting energy reduction) - Process optimization reducing thermal/electrical intensity - Renewable energy integration (solar, wind PPAs or on-site generation)

Typical Outcomes:- 20-30% energy cost reduction - 2-3 year payback periods - Rs 1.2-3.5 crore annual savings for mid-sized facilities
Waste to Value Conversion:- Fly ash, slag, recycled aggregates integration (replacing virgin materials) - Industrial waste as alternative fuel sources (refuse-derived fuel, biomass) - Water recycling systems (reducing freshwater consumption 40-60%) - Packaging material recovery and reuse
Typical Outcomes:- 8-15% material cost reduction - Rs 80 lakh-2 crore annual savings from waste monetization - Reduced disposal costs (landfill fees, environmental compliance)
Process Redesign:- Lower-carbon formulations (partial clinker replacement in cement, recycled steel in rebar) - Circular material flows (closed-loop water systems, material recovery) - Digitalization reducing trial-and-error waste (AI-optimized mix designs)
Real Example: Steel manufacturer integrated 30% recycled scrap, installed electric arc furnaces, deployed AI optimization. Results: 28% energy reduction, 35% carbon footprint reduction, 12% production cost reduction. Green transition delivered margin expansion, not cost burden.
Investment Required: Rs 1.5-5 crore (energy systems, waste recovery, process optimization) Payback Period: 18-30 months from operational savings alone (before considering green premiums)
Phase 3: Product Innovation as Differentiation (Months 12-24)

Green Product Development Criteria:- Meets or exceeds conventional product performance (strength, durability, aesthetics) - Incorporates 15-25% recycled content (ahead of regulatory requirements) - Third-party certified (LEED-compliant, IGBC-approved, GRIHA-qualified) - Transparent material sourcing (blockchain or equivalent traceability) - Lower lifecycle carbon footprint (cradle-to-gate analysis)
Strategic SKU Architecture:- Tier 1 - Premium Green: 25%+ recycled content, premium certifications, 15-18% price premium - Tier 2 - Standard Green: 15-20% recycled content, basic certifications, 8-12% price premium - Tier 3 - Compliance Green: 5-10% recycled content, regulatory compliance, price parity
Why Three Tiers Matter: Captures entire market (ultra-premium projects to cost-sensitive affordable housing) while maintaining green positioning across portfolio.
Technical Validation Requirements:- Independent testing verifying performance equivalence - Durability studies demonstrating lifecycle advantages - Application case studies from reference projects - Continuous quality monitoring (recycled content variability management)
Go-to-Market Strategy:- Target LEED/IGBC-seeking developers first (built-in demand) - Secure government infrastructure specifications approval (NCRTC, NHAI, metro projects) - Premium residential developer partnerships (brand alignment) - Architect and consultant education programs (specification influencers)
Real Example: Fiber cement board manufacturer developed 20% recycled content product line. Secured IGBC certification, targeted green commercial buildings. Achieved 14% price premium, 27% faster specification rate from sustainability-focused architects, 340 basis points better margins than conventional products.
Investment Required: Rs 2-6 crore (R&D, testing, certifications, pilot production) Revenue Impact: 15-30% of portfolio green SKUs within 18 months, carrying 200-400 bps margin premium
Phase 4: Premium Positioning as Market Capture (Months 18-36)
The Paradox: Green products cost more to develop but less to produce at scale. Early movers capture premium pricing before scale economics commoditize green category.Brand Architecture:- Sustainability as core brand positioning (not CSR add-on) - Technical credibility through certifications and third-party validation - Transparency as differentiation (material traceability, carbon labeling, lifecycle data) - Thought leadership in industry sustainability transitions
Customer Segmentation:- Segment 1 - Green Mandated: Projects requiring certifications (government, Grade A commercial, international developers) - Segment 2 - Green Aspirational: Premium residential, corporate campuses, sustainability-focused private developers - Segment 3 - Green Curious: Mid-market projects exploring green options for competitive differentiation
Pricing Strategy:- Segment 1: Price to specification compliance + modest premium (low price sensitivity, high volume potential) - Segment 2: Premium pricing justified by brand, performance, certifications (high margin, medium volume) - Segment 3: Price parity to conventional products (market development, volume building)
Sales Enablement:- Green ROI calculators for developers (LEED certification value, energy savings, faster approvals) - Specification comparison tools (performance + sustainability metrics) - Carbon footprint reporting for customer ESG disclosures - Case studies quantifying green building advantages
Real Example: Paint manufacturer repositioned entire portfolio around low-VOC, sustainable formulations. Educated architect community on health impacts, secured LEED-compliant specifications, demonstrated no performance trade-offs. Result: 18% price premium in premium residential segment, 40% share gain in green-certified commercial projects, became default specification for sustainability-focused architects.
Marketing Investment: Rs 60 lakh-2 crore annually (thought leadership, technical education, customer tools) Revenue Impact: 12-18% realized price premium, 25-40% share gain in green-certified project segments.
The Integration Imperative: Why Phases Can’t Be Sequential
The framework shows phases sequentially for clarity. Execution must be parallel.Operational efficiency (Phase 2) funds product innovation (Phase 3).
Energy savings and waste-to-value generate cash flow financing R&D and certifications.
Product innovation (Phase 3) enables premium positioning (Phase 4).
Can’t command green premiums without differentiated, certified products.
Premium positioning (Phase 4) justifies compliance infrastructure (Phase 1).
Customer willingness to pay for transparency makes traceability systems ROI-positive.
Compliance foundation (Phase 1) de-risks operational changes (Phase 2).
Knowing current footprint prevents efficiency investments that don’t reduce carbon intensity.
Companies that execute phases sequentially take 4-5 years and miss market windows. Companies executing in parallel achieve transformation in 24-30 months while competitors still analyze.
The Financial Reality: Real Outcomes From Green Transition
The framework is theoretical until proven with P&L impact.Industry data from companies that executed systematic green transitions (not pilots, not green-washing, actual portfolio transformation):
Cost Reduction Outcomes:
Energy Efficiency: - 20-30% total energy cost reduction - Rs 1.2-3.5 crore annual savings (mid-sized facility) - Rs 42,000 annual HVAC savings per 10,000 sq ft facility (LEED buildings) - 18-30 month payback on efficiency investmentsMaterial Optimization:- 8-15% material cost reduction through waste recovery - Rs 80 lakh-2 crore annual savings from waste-to-value conversion - 30-40% reduction in virgin material consumption (partial recycled content replacement) - Negative cost for recycled aggregates vs. quarried materials in many regions
Water Management:- 40-60% freshwater consumption reduction - Rs 15-45 lakh annual savings (water + wastewater treatment) - Reduced regulatory compliance costs in water-stressed regions
Operational Efficiency:- 12-18% production cost reduction from process optimization - 15-20% reduction in quality defects (better process control from digitalization) - 25% reduction in unplanned downtime (predictive maintenance from IoT sensors)
Revenue Enhancement Outcomes:
Premium Pricing:- 12-18% price premium for certified green products (premium segments) - 8-12% price premium for standard green products (mid-market) - Price parity or slight premium for compliance green products (mass market)Market Access: - 100% qualification rate for green-certified projects (vs. 0% for non-green competitors) - 30-45% faster specification adoption from sustainability-focused architects - Preferred vendor status with ESG-conscious developers and government agencies
Volume Growth:- 25-40% share gain in green-certified project segments - 15-25% revenue CAGR in green product lines (vs. 6-8% conventional products) - First-mover advantages in emerging green segments
Strategic Value Creation:
EBITDA Impact:- 340-400 basis points EBITDA improvement (combined cost reduction + premium pricing) - Margin expansion while conventional competitors face compressionCarbon Performance: - 34% CO2 reduction (LEED certified buildings) - 25% energy savings (ECBC compliance) - 11% water consumption reduction - 50-65% waste diversion from landfills
Valuation Multiples:- ESG-leading companies trade at 15-25% valuation premiums vs. peers - Access to green financing (lower cost of capital) - Improved credit ratings from reduced environmental risks
Risk Mitigation: - Regulatory compliance ahead of mandates (avoiding scramble costs) - Reduced exposure to carbon pricing mechanisms - Lower environmental liability risks - Enhanced license to operate in communities
Real Example - Comprehensive Transformation:
Large building materials company (Rs 2,400 crore revenue, cement + concrete + aggregates) executed full green transition over 30 months:
- Investment: Rs 18 crore (energy systems, R&D, certifications, supply chain)
- Energy savings: Rs 5.2 crore annually
- Material cost reduction: Rs 3.8 crore annually
- Green product premium revenue: Rs 12 crore annually (Year 2)
- EBITDA improvement: 380 basis points
- Payback period: 22 months
- Market cap increase: 28% (outperforming sector index by 19%)
Why Many Building Materials Companies Are Yet to Act

The barriers aren’t technical or financial. They’re organizational and psychological.
The Analysis Paralysis Trap: “We need more data on recycled material consistency”
“Let’s pilot for another 12 months to validate”
“We should wait to see what competitors do”
Reality: Perfect information doesn’t exist. Competitors who move with 70% confidence while others wait for 95% confidence capture market position that’s difficult to reverse.
The CFO Cost Lens: Finance teams trained to minimize costs see Rs 15 crore green transition investment and calculate payback periods without factoring: - Premium pricing power (revenue side, not just cost side) - Market access to green-certified projects (volume growth, not just margins) - Competitive obsolescence risk (future cost of NOT investing)
Reality: Green transition is growth investment, not cost center. Evaluating with cost-reduction criteria guarantees wrong decision.
The Operations Resistance: Plant managers who’ve run processes the same way for 20 years perceive green transition as: - Production risk (new formulations, recycled content variability) - Complexity addition (separate product lines, quality control) - Efficiency threat (trial-and-error during transition)
Reality: Operations teams resist change until new processes prove superior. Then they resist changing back. The transition period discomfort is temporary. The competitive advantage is permanent.
The “Our Customers Don’t Care” Delusion: Sales teams report customers aren’t asking for green products, therefore no market demand.
Reality: Customers don’t ask for products they don’t know exist or believe come with performance/cost trade-offs. Premium developers didn’t ask for green cement until manufacturers proved it existed at reasonable premiums with verified performance.
The Delegation Fallacy: Boards assign ESG to CSR teams, treating it as reputation management, not business strategy.
Reality: ESG transformation requires operations, R&D, supply chain, sales integration. CSR teams can report progress. They can’t rewire business models. CEO-led green transition succeeds. Delegated sustainability initiatives generate reports.
A Practical 90-Day Roadmap to Initiate Green Transition
For building materials CEOs are convinced of strategic imperative but uncertain of starting point:Days 1-30: Diagnostic and Baseline
- Commission comprehensive carbon footprint analysis (Scope 1, 2, 3)
- Map current waste streams with recovery value quantification
- Energy audit across all facilities with optimization opportunities
- Competitive benchmarking (who’s ahead in green transition, by how much)
- Customer segmentation analysis (green-mandated vs. green-aspirational vs. price-focused)
- Regulatory roadmap (EPR 2026/2028/2031, ECBC requirements, certification standards)
- Internal capability assessment (technical, operational, commercial readiness)
Days 31-60: Strategy and Business Case
- Define green transition ambition (full portfolio vs. select product lines, timeline, investment)
- Build financial model (investment required, cost reduction potential, premium pricing opportunity, payback analysis)
- Identify quick wins (high-impact, low-complexity energy/waste projects for immediate savings)
- Prioritize product development (which SKUs green first, based on margin potential + market demand)
- Technology partnership evaluation (renewable energy, recycled material suppliers, certification bodies)
- Organizational design (who owns green transition - not CSR team, integrated operating model)
- Stakeholder alignment (Board approval, leadership commitment, communication strategy)
Days 61-90: Execution Launch
- Green transition program office established (dedicated team, CEO-sponsored, cross-functional)
- Quick-win projects launched (immediate energy/waste savings funding longer-term investments)
- Recycled material supply agreements negotiated (EPR compliance pathway secured)
- Product development initiated (green SKU formulations, testing protocols, certification applications)
- Pilot facility identified (full green integration to prove model before scaling)
- Technology partnerships finalized (renewable energy, IoT monitoring, carbon accounting platforms)
- Customer pilot engagements (early adopter developers for green product validation)
- Employee communication (why green transition, what changes, how everyone contributes)
The 90-Day Objective: Move from analysis to action. Shift conversation from “should we” to “here’s how we’re doing it.”
The Competitive Reality April 2026 Creates
April 2026 EPR deadline isn’t the end of green transition. It’s the beginning of market restructuring.What Happens to Companies in Each Category:
Compliance Minimalists:- April 2026: Scramble to 5% recycled content, source cheapest materials, blend minimally - Q3 2026: Discover premium developers who require 15-20% recycled content for LEED certification - 2027: Lose bids on green-certified projects (fastest-growing segment) - 2028: EPR escalates to 15%, repeat scramble, still behind market requirements - 2029-2030: Market share erosion accelerates as green becomes default specification - 2031: EPR at 25%, conventional products increasingly non-compliant, shrinking addressable market
Outcome: Slow market exit through competitive obsolescence
Fragmented Adopters:- April 2026: Launch green product lines, maintain conventional core - 2026-2027: Modest success in green segments, but sub-scale economics prevent competitive pricing - 2028: Competitors with unified green strategies achieve better margins through scale - 2029: Split portfolio creates organizational confusion, resource conflicts - 2030-2031: Forced to choose full green transition (late, expensive) or exit green segments (shrinking addressable market)
Outcome: Squeezed middle - neither cost leader nor differentiation leader
Systematic Transformers: - 2024-2025: Full green transition initiated, operational efficiency + product innovation parallel - April 2026: Already 15-20% recycled content across portfolio, EPR compliance non-event - 2026-2027: Premium pricing + scale economics create margin expansion - 2028: EPR escalation to 15% strengthens position vs. lagging competitors - 2029-2030: Green becomes default portfolio, conventional products phased out - 2031: EPR at 25% reached two years early, market leadership cemented
Outcome: Market dominance through first-mover advantages, technical credibility, scale economics
The Pattern: April 2026 separates reactive compliance from proactive strategy. The subsequent five years compound that initial positioning into insurmountable competitive gaps.
The Question India’s Building Materials Industry Must Answer
Can ESG be competitive advantage instead of compliance cost?
The market data says yes:Rs 3.22 lakh crore green building materials market by 2032, growing 11.3% annually (3X conventional materials growth). Premium pricing of 12-18% for certified green products. EBITDA improvements of 340-400 basis points from systematic green transitions.
The operational data says yes:
34% carbon reduction. 25% energy savings. 20-30% energy cost reduction. 8-15% material cost reduction through waste-to-value. 18-30 month payback periods on green investments.
The strategic data says yes:
First movers capturing green-certified project segments. Late movers increasingly locked out of premium market segments. Regulatory escalation (EPR 5% 15% 25%) accelerating competitive divergence.
The only remaining question:
Will building materials CEOs lead green transition proactively for competitive advantage? Or react to regulations for compliance survival?
The companies making that decision in 2024-2025 are building market leadership positions for the next decade.
The companies making that decision in 2027-2028 are fighting for survival.
April 2026 is the marker. But the decisions being made today determine which side of that line companies occupy.
India’s Rs 6.4 lakh crore building materials industry is entering its most significant transformation since liberalization. The structures we build will increasingly require verified sustainable materials. The developers will increasingly demand green certifications. The regulations will increasingly mandate recycled content.
The only variable: Whether individual companies see this transformation as threat to resist or opportunity to weaponize.
For CEOs with 28 years watching industry cycles, the pattern is unmistakable: Transformations don’t wait for consensus. They reward early movers and penalize late adopters.
Green transition isn’t different. It’s just the latest cycle where that truth will prove itself through P&L statements and market share charts.
What This Means for Contractors and Infrastructure Developers
The green building materials transition isn’t just a manufacturer’s concern. For contractors, project developers, and infrastructure agencies, April 2026 EPR regulations and the broader sustainability shift create immediate implications that will reshape project economics, vendor relationships, and competitive positioning.The Opportunity: Early-Mover Advantage in Green-Certified Projects
Infrastructure developers and contractors who establish green material sourcing capabilities today gain substantial competitive advantages:Government Project Preference: NCRTC, NHAI, metro rail corporations, and smart city projects increasingly mandate LEED/IGBC/GRIHA certifications. Contractors with verified green material supply chains qualify for 100% of these tenders. Those without? Locked out of the fastest-growing infrastructure segment worth Rs 10+ lakh crore through 2030.
Premium Pricing Power: Commercial developers pursuing Grade A certifications accept 8-12% higher construction costs for green buildings. Why? Tenant premiums of 15-20%, faster lease-up (40% quicker), and 25-30% higher asset valuations. Contractors delivering certified green construction command corresponding premiums.
Risk Mitigation: Projects using non-compliant materials post-April 2026 face occupancy certificate delays, penalty exposure, and potential demolition orders in extreme cases. Early adoption eliminates regulatory risk.
The Challenge: Navigating Supply Chain Transformation
The transition creates three immediate procurement challenges:Material Availability Constraints: Currently, only 30-35% of building material manufacturers offer EPR-compliant products with verified recycled content. As demand surges post-April 2026, supply shortages are inevitable. Contractors securing long-term supply agreements with systematic transformers (Category 3 manufacturers) today avoid 2026-2027 shortages and spot-market premiums.
Verification Complexity: Green material claims without third-party certification are worthless for project compliance. Contractors need systematic verification processes: blockchain traceability for recycled content percentages, batch-level carbon intensity documentation, and LEED/IGBC pre-approved material databases. Building internal green procurement expertise or partnering with specialized consultants becomes essential.
Cost Predictability: Green material pricing is currently volatile as markets adjust. The 8-12% premium today might compress to 4-6% by 2028 as production scales, or expand to 15-18% if supply constraints worsen. Fixed-price contracts without green material cost escalation clauses expose contractors to margin compression. Smart contracting includes material indexation tied to green certification premiums.
The Strategic Response: Three-Horizon Approach for Project Stakeholders
Horizon 1 (Next 6 Months): Build Green Supply Chain Visibility- Audit current material suppliers: Who offers EPR-compliant products? Who’s investing in green transition vs. waiting?
- Establish relationships with Category 3 manufacturers (systematic transformers) before their order books fill
- Develop green material verification protocols: How will you confirm 15% recycled content claims?
- Train procurement teams on sustainability certifications and green material specifications
- Negotiate long-term supply agreements (18-36 months) with certified green material suppliers
- Pilot green materials on smaller projects to understand performance, cost, and logistics
- Build green construction capabilities: Train site teams, update quality control processes
- Develop project-level carbon accounting systems (increasingly required for government tenders)
- Pursue LEED AP / IGBC AP certifications for key personnel (demonstrates expertise to clients)
- Develop pre-qualified green supply chains: Vetted suppliers, verified materials, predictable costs
- Build track record: Completed green-certified projects become competitive differentiators
- Partner with developers early in design phase to optimize green material selection
The Bottom Line for Project Stakeholders
The green materials transition creates a clear bifurcation among contractors and developers:Those who wait: Face April 2026 scrambles for compliant materials, pay spot-market premiums during shortages, get locked out of green-certified project tenders worth Rs 2-2.5 lakh crore, and watch competitors capture premium commercial and government segments.
Those who prepare: Secure preferred supplier relationships before order books fill, develop green construction expertise ahead of market demand, qualify for 100% of infrastructure tenders (not just compliant segments), and command 8-12% premium pricing on certified green projects.
For infrastructure developers, the calculation is straightforward: Green-certified buildings deliver 15-20% tenant premiums, 25-30% higher asset valuations, and 40% faster lease-up. The incremental 8-12% construction cost from green materials generates 3-4X return through enhanced project economics.
For contractors, green construction capability transforms from nice-to-have into must-have. The Rs 10 lakh crore infrastructure pipeline through 2030 increasingly requires certified sustainable materials. Contractors without green supply chains won’t just miss premium projects—they’ll lose access to mainstream government and commercial work.
The green transition isn’t a compliance burden to minimize. It’s a market restructuring creating winners and losers. The question for every contractor and developer: Which side of that divide will you occupy?
About the Author:
Abinash Mishra is a seasoned CEO and transformation leader with over 28 years of experience across cement, steel, paints, concrete, and allied building materials. An alumnus of IIT Bombay and Olin Business School, Washington University in St. Louis, he has led large-scale growth, turnaround, and customer-centric transformation programs spanning Rs 5,000+ Crore P&Ls. Recognized as a Deloitte Top 1% High Impact Leader, he serves as an International Ambassador of the Management Strategy Institute, USA, and a Subject Matter Expert to NCRTC and other National Navaratna infrastructure agencies.
Published on:
19 March 2026
Published in: ICCT, January-February, 2026
Share:
We Value Your Comment